andreas.singraber wrote: Sat Feb 07, 2026 2:09 pm
Hello!
Thanks for providing a clear description of the issue and detailed timing tables, this is very helpful for analyzing the situation!
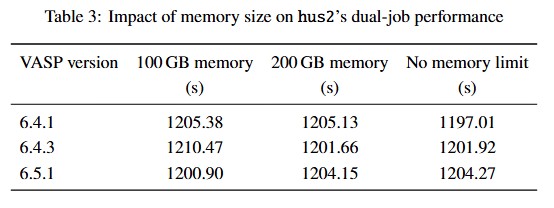
First, I agree that this is definitely not an issue related to memory capacity. However, memory bandwidth most likely is playing a role here together with MPI rank placement. Actually, I am already unsure whether the 1.5x timing increase on the hus1 system is acceptable, because theoretically the 2x 48-core jobs should perfectly fit the 2x 48-core CPUs. Ideally, one would hope that each job runs entirely on one of the two CPUs and uses only the memory adjacent to this CPU. Without any "overlap" the timings should not degrade compared to the single job performance (maybe a few percent because the OS sometimes needs a little share of the occupied cores). On the other hand, if the two jobs are bandwidth-limited and they need to share the available memory bandwidth the 1.5x timing increase is maybe fine. Anyway, this should be checked by looking at the MPI rank placement.
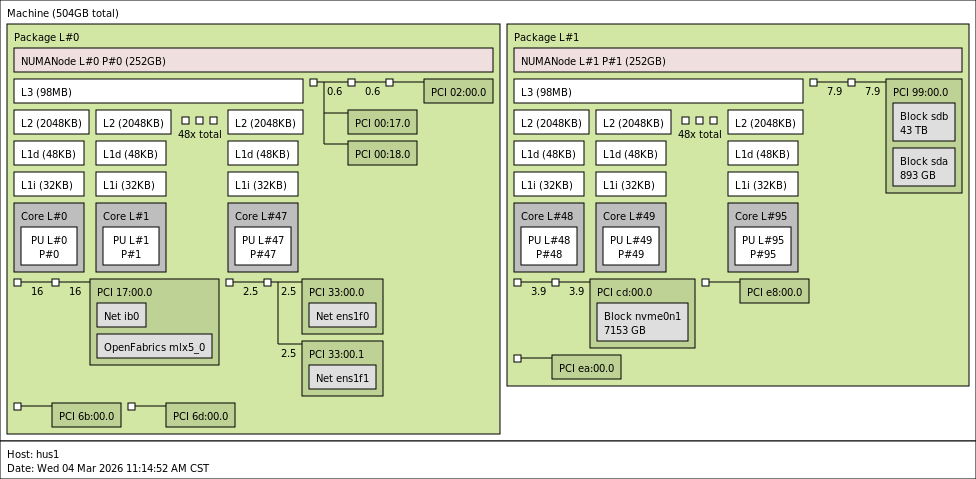
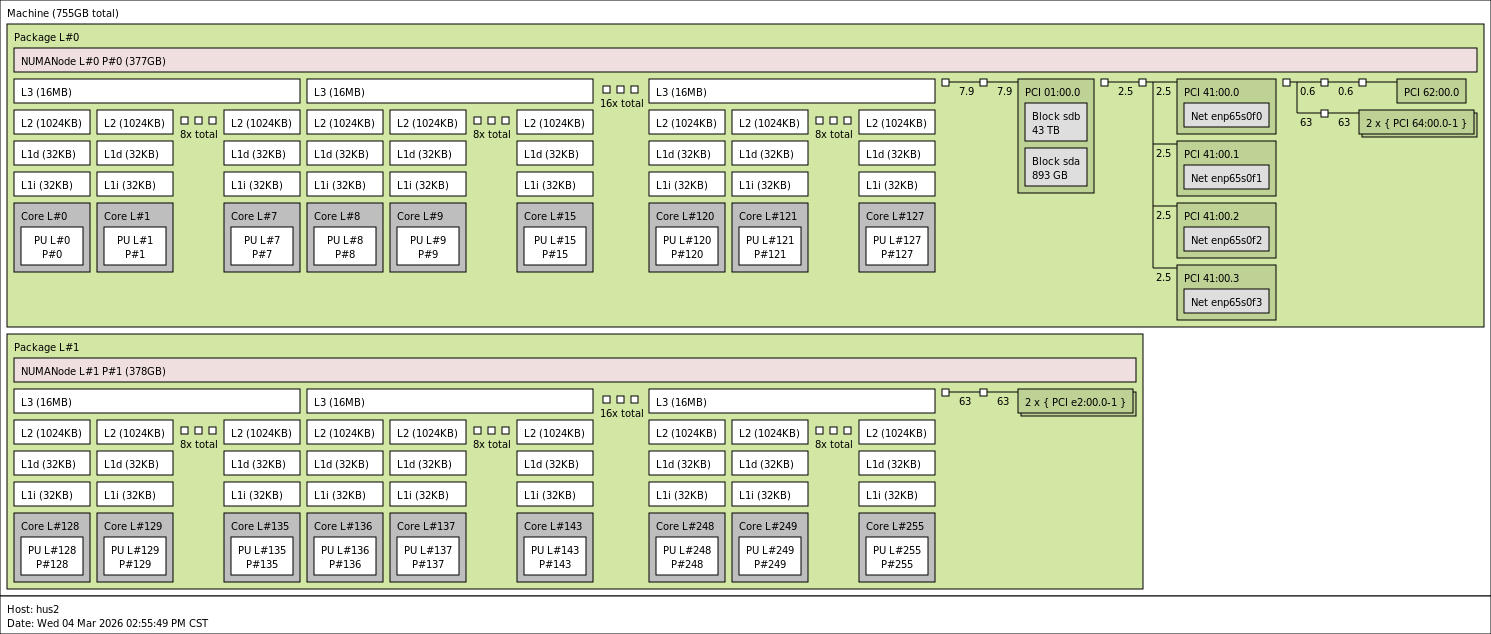
Maybe some more context: with today's high-core-count CPUs there is unfortunately a lot to consider to effectively make use of all the available compute power. Hence, one cannot view a node like hus1 and hus2 as a "homogeneous" device, rather it has some internal structure which needs to be reflected in the way multi-process programs like VASP get executed on them. Both your machines are dual-socket, i.e., there are two CPUs of the same type available. The first thing to be aware here is that the installed memory is actually split between these CPUs, with one half being closer to CPU A and the other half closer to CPU B. "Closer" in this context means that there is a performance penalty in terms of latency if e.g. CPU A tries to access data which is present in memory attached to CPU B. The technical term for this non-homogeneity is Non-Uniform Memory Access (NUMA). Thus, both of your systems have at least two NUMA domains. However, the situation gets more complicated: both CPUs (Intel 8475B and AMD 9754) have an internal structure which makes the individual cores have different "distances" to memory and L3 cache. Effectively, you can have up to 4 NUMA domains per CPU, ending up with 8 NUMA domains per node (this depends on your BIOS settings). The situation is more pronounced on the AMD CPUs because there are much more cores which have to share actually less total memory bandwidth (see your first table). You can get information about the actual situation on your machines with these commands:
The last command lets you also print a nice image like the one on your Wiki: https://vasp.at/wiki/Optimizing_the_par ... e_hardware. Could you post the output of these commands for your systems?
It is important to know that without further intervention the operating system will automatically try to load-balance the cores in your system by shifting the executed program (or its MPI processes) around between the actual physical cores. This sounds nice, but it is potentially harmful for performance because the individual tasks of a multi-process program are often moved away from the memory they were initially close to. Hence, for optimal performance it is always required to "pin" the MPI processes to physical cores. This is usually done via arguments to the mpirun command, see also the Wiki link above. To check how the MPI tasks are actually pinned to cores you can use these additional command-line arguments to mpirun:
Code: Select all
# OpenMPI
mpirun --report-bindings ...

# Intel MPI
mpirun -genv I_MPI_DEBUG=4 ...

# SLURM
srun --cpu-bind=verbose ...
For example, with OpenMPI you should get lines like this on your screen output:
Code: Select all
[wahoo01.vasp.co:2711168] MCW rank 0 bound to socket 0[core 0[hwt 0]]: [B./../../../../../../../../../../../../../../../../../../../../../../../../../../../../../../../../../../../../../../../../../../../../../../..]
[wahoo01.vasp.co:2711168] MCW rank 1 bound to socket 0[core 1[hwt 0]]: [../B./../../../../../../../../../../../../../../../../../../../../../../../../../../../../../../../../../../../../../../../../../../../../../..]
[wahoo01.vasp.co:2711168] MCW rank 2 bound to socket 0[core 2[hwt 0]]: [../../B./../../../../../../../../../../../../../../../../../../../../../../../../../../../../../../../../../../../../../../../../../../../../..]
[wahoo01.vasp.co:2711168] MCW rank 3 bound to socket 0[core 3[hwt 0]]: [../../../B./../../../../../../../../../../../../../../../../../../../../../../../../../../../../../../../../../../../../../../../../../../../..]
[wahoo01.vasp.co:2711168] MCW rank 4 bound to socket 0[core 4[hwt 0]]: [../../../../B./../../../../../../../../../../../../../../../../../../../../../../../../../../../../../../../../../../../../../../../../../../..]
[wahoo01.vasp.co:2711168] MCW rank 5 bound to socket 0[core 5[hwt 0]]: [../../../../../B./../../../../../../../../../../../../../../../../../../../../../../../../../../../../../../../../../../../../../../../../../..]
[wahoo01.vasp.co:2711168] MCW rank 6 bound to socket 0[core 6[hwt 0]]: [../../../../../../B./../../../../../../../../../../../../../../../../../../../../../../../../../../../../../../../../../../../../../../../../..]
...
With these pinning reports enabled, can you please run your tests again for both systems, each with running a single job and two jobs, and attach the output here? With this information we should be able to get a clearer picture of where the performance is lost, in particular on the hus2 system.
Thank you!
All the best,
Andreas Singraber
P.S. Sorry for the lengthy introduction to CPU architecture, maybe there is nothing new to you at all... but maybe some other users will find this helpful.
Dear Andreas,
Thanks a lot for the detailed and patient explanation. Your overview of the NUMA architecture, memory bandwidth, and MPI rank placement was really clear, and it definitely helped us better understand the performance issues we’re seeing.
First, I agree that this is not a memory capacity issue but is more likely related to memory bandwidth and how the MPI ranks are actually placed. As you pointed out, in theory, on a dual-socket node with two 48-core CPUs, running two 48-core jobs at the same time should not lead to a noticeable performance drop, as long as each job is fully bound to its own CPU and mainly accesses the memory adjacent to this CPU. The \(\sim1.5\times\) increase in runtime we’re seeing on hus1 does suggest we should take a closer look at the MPI rank placement to make sure it’s doing what we expect.
As for the NUMA topology, we’ll take your advice and gather the following information on hus1 and hus2:
command lscpu
hus1
Code: Select all
Architecture:        x86_64
CPU op-mode(s):      32-bit, 64-bit
Byte Order:          Little Endian
CPU(s):              96
On-line CPU(s) list: 0-95
Thread(s) per core:  1
Core(s) per socket:  48
Socket(s):           2
NUMA node(s):        2
Vendor ID:           GenuineIntel
CPU family:          6
Model:               143
Model name:          Intel(R) Xeon(R) Platinum 8475B
Stepping:            8
CPU MHz:             2700.000
CPU max MHz:         3800.0000
CPU min MHz:         800.0000
BogoMIPS:            5400.00
Virtualization:      VT-x
L1d cache:           48K
L1i cache:           32K
L2 cache:            2048K
L3 cache:            99840K
NUMA node0 CPU(s):   0-47
NUMA node1 CPU(s):   48-95
hus2
Code: Select all
Architecture:        x86_64
CPU op-mode(s):      32-bit, 64-bit
Byte Order:          Little Endian
CPU(s):              256
On-line CPU(s) list: 0-255
Thread(s) per core:  1
Core(s) per socket:  128
Socket(s):           2
NUMA node(s):        2
Vendor ID:           AuthenticAMD
CPU family:          25
Model:               160
Model name:          AMD EPYC 9754 128-Core Processor
Stepping:            2
CPU MHz:             2250.000
CPU max MHz:         3100.3411
CPU min MHz:         1500.0000
BogoMIPS:            4493.37
Virtualization:      AMD-V
L1d cache:           32K
L1i cache:           32K
L2 cache:            1024K
L3 cache:            16384K
NUMA node0 CPU(s):   0-127
NUMA node1 CPU(s):   128-255
[\code]
[b]command[/b] [tt][color=#008000]numactl -H[/color][/tt]
[b][i]hus1[/i][/b]
[code]
available: 2 nodes (0-1)
node 0 cpus: 0 1 2 3 4 5 6 7 8 9 10 11 12 13 14 15 16 17 18 19 20 21 22 23 24 25 26 27 28 29 30 31 32 33 34 35 36 37 38 39 40 41 42 43 44 45 46 47
node 0 size: 257639 MB
node 0 free: 226996 MB
node 1 cpus: 48 49 50 51 52 53 54 55 56 57 58 59 60 61 62 63 64 65 66 67 68 69 70 71 72 73 74 75 76 77 78 79 80 81 82 83 84 85 86 87 88 89 90 91 92 93 94 95
node 1 size: 257989 MB
node 1 free: 157854 MB
node distances:
node   0   1
  0:  10  21
  1:  21  10
hus2
Code: Select all
available: 2 nodes (0-1)
node 0 cpus: 0 1 2 3 4 5 6 7 8 9 10 11 12 13 14 15 16 17 18 19 20 21 22 23 24 25 26 27 28 29 30 31 32 33 34 35 36 37 38 39 40 41 42 43 44 45 46 47 48 49 50 51 52 53 54 55 56 57 58 59 60 61 62 63 64 65 66 67 68 69 70 71 72 73 74 75 76 77 78 79 80 81 82 83 84 85 86 87 88 89 90 91 92 93 94 95 96 97 98 99 100 101 102 103 104 105 106 107 108 109 110 111 112 113 114 115 116 117 118 119 120 121 122 123 124 125 126 127
node 0 size: 386182 MB
node 0 free: 284077 MB
node 1 cpus: 128 129 130 131 132 133 134 135 136 137 138 139 140 141 142 143 144 145 146 147 148 149 150 151 152 153 154 155 156 157 158 159 160 161 162 163 164 165 166 167 168 169 170 171 172 173 174 175 176 177 178 179 180 181 182 183 184 185 186 187 188 189 190 191 192 193 194 195 196 197 198 199 200 201 202 203 204 205 206 207 208 209 210 211 212 213 214 215 216 217 218 219 220 221 222 223 224 225 226 227 228 229 230 231 232 233 234 235 236 237 238 239 240 241 242 243 244 245 246 247 248 249 250 251 252 253 254 255
node 1 size: 386974 MB
node 1 free: 203971 MB
node distances:
node   0   1
  0:  10  32
  1:  32  10
command lstopo
hus1
hus2
We reran the same job on hus1 and hus2 to check the runtime again. For Intel MPI, we enabled pinning using mpirun -genv I_MPI_PIN=ON, and also set mpirun -genv I_MPI_DEBUG=4 to print the MPI pinning information so we could confirm how the ranks are mapped to sockets and cores.
We’ve collected the outputs and the MPI binding reports and shared them below for your reference.
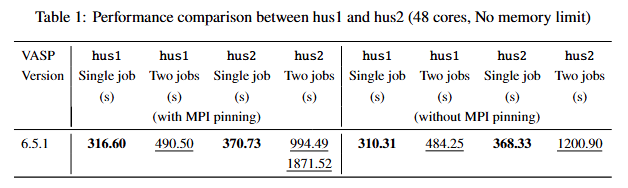
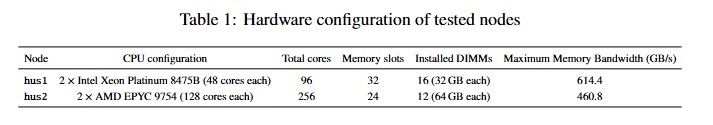
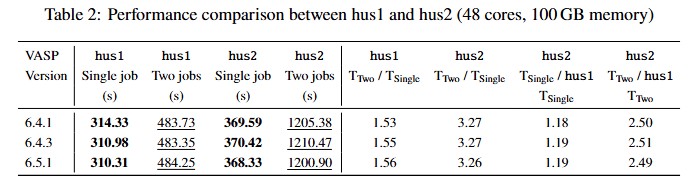
Based on the test results (see in Table 1), on the hus1 node we do not observe any noticeable difference in computational performance before and after MPI pinning, neither for single-job nor for dual-job runs. The situation on hus2 seems to be somewhat different. For single-job execution, MPI pinning has almost no visible impact on performance. However, when running two jobs concurrently, the behavior before and after pinning differs more clearly. Without MPI pinning, both jobs show very similar runtimes of \(\sim\) 1200 s. After enabling MPI pinning, one of the jobs becomes slightly faster (\(\sim\) 994 s), while the other slows down significantly (\(\sim\) 1872 s}). As a result, MPI pinning does not lead to an overall performance improvement for concurrent multi-job execution on hus2, but instead introduces a pronounced imbalance between the two jobs.
Running a single job
hus1
Code: Select all
[0] MPI startup(): Rank    Pid      Node name  Pin cpu
[0] MPI startup(): 0       1832336  hus1       {0,1}
[0] MPI startup(): 1       1832337  hus1       {2,3}
[0] MPI startup(): 2       1832338  hus1       {4,5}
...
[0] MPI startup(): 46      1832383  hus1       {92,93}
[0] MPI startup(): 47      1832384  hus1       {94,95}
 running   48 mpi-ranks, on    1 nodes
 distrk:  each k-point on   48 cores,    1 groups
 distr:  one band on   12 cores,    4 groups
hus2
Code: Select all
[0] MPI startup(): Rank    Pid      Node name  Pin cpu
[0] MPI startup(): 0       2554478  hus2       {0-5}
[0] MPI startup(): 1       2554479  hus2       {6-11}
[0] MPI startup(): 2       2554480  hus2       {12-17}
...
[0] MPI startup(): 46      2554524  hus2       {246-250}
[0] MPI startup(): 47      2554525  hus2       {251-255}
 running   48 mpi-ranks, on    1 nodes
 distrk:  each k-point on   48 cores,    1 groups
 distr:  one band on   12 cores,    4 groups
Running two jobs on the same node
hus1
Code: Select all
[0] MPI startup(): Rank    Pid      Node name  Pin cpu
[0] MPI startup(): 0       1832750  hus1       {0}
[0] MPI startup(): 1       1832751  hus1       {1}
[0] MPI startup(): 2       1832752  hus1       {2}
...
[0] MPI startup(): 46      1832841  hus1       {46}
[0] MPI startup(): 47      1832843  hus1       {47}
 running   48 mpi-ranks, on    1 nodes
 distrk:  each k-point on   48 cores,    1 groups
 distr:  one band on   12 cores,    4 groups
hus2
Code: Select all
[0] MPI startup(): Rank    Pid      Node name  Pin cpu
[0] MPI startup(): 0       2555189  hus2       {0}
[0] MPI startup(): 1       2555190  hus2       {1}
[0] MPI startup(): 2       2555191  hus2       {2}
[0] MPI startup(): 3       2555192  hus2       {3}
[0] MPI startup(): 4       2555193  hus2       {4}
[0] MPI startup(): 5       2555194  hus2       {5}
[0] MPI startup(): 6       2555195  hus2       {6}
[0] MPI startup(): 7       2555196  hus2       {7}
[0] MPI startup(): 8       2555197  hus2       {8}
[0] MPI startup(): 9       2555198  hus2       {9}
[0] MPI startup(): 10      2555199  hus2       {10}
[0] MPI startup(): 11      2555200  hus2       {11}
[0] MPI startup(): 12      2555201  hus2       {12}
[0] MPI startup(): 13      2555202  hus2       {13}
[0] MPI startup(): 14      2555203  hus2       {14}
[0] MPI startup(): 15      2555204  hus2       {15}
[0] MPI startup(): 16      2555205  hus2       {32}
[0] MPI startup(): 17      2555206  hus2       {33}
[0] MPI startup(): 18      2555207  hus2       {34}
[0] MPI startup(): 19      2555208  hus2       {35}
[0] MPI startup(): 20      2555209  hus2       {36}
[0] MPI startup(): 21      2555210  hus2       {37}
[0] MPI startup(): 22      2555211  hus2       {38}
[0] MPI startup(): 23      2555212  hus2       {39}
[0] MPI startup(): 24      2555213  hus2       {40}
[0] MPI startup(): 25      2555214  hus2       {41}
[0] MPI startup(): 26      2555215  hus2       {42}
[0] MPI startup(): 27      2555216  hus2       {43}
[0] MPI startup(): 28      2555217  hus2       {44}
[0] MPI startup(): 29      2555218  hus2       {45}
[0] MPI startup(): 30      2555219  hus2       {46}
[0] MPI startup(): 31      2555220  hus2       {47}
[0] MPI startup(): 32      2555221  hus2       {96}
[0] MPI startup(): 33      2555222  hus2       {97}
[0] MPI startup(): 34      2555223  hus2       {98}
[0] MPI startup(): 35      2555224  hus2       {99}
[0] MPI startup(): 36      2555225  hus2       {100}
[0] MPI startup(): 37      2555226  hus2       {101}
[0] MPI startup(): 38      2555227  hus2       {102}
[0] MPI startup(): 39      2555228  hus2       {103}
[0] MPI startup(): 40      2555229  hus2       {104}
[0] MPI startup(): 41      2555230  hus2       {105}
[0] MPI startup(): 42      2555231  hus2       {106}
[0] MPI startup(): 43      2555232  hus2       {107}
[0] MPI startup(): 44      2555233  hus2       {108}
[0] MPI startup(): 45      2555234  hus2       {109}
[0] MPI startup(): 46      2555235  hus2       {110}
[0] MPI startup(): 47      2555236  hus2       {111}
 running   48 mpi-ranks, on    1 nodes
 distrk:  each k-point on   48 cores,    1 groups
 distr:  one band on   12 cores,    4 groups
Regarding the MPI pinning reports, on hus1 we observe that the pinning behavior changes depending on whether one or two jobs are running. When a single job is executed, each MPI rank is pinned to two CPU cores. In this case, the 0–7 and 25–32 MPI ranks are pinned to six CPU cores, while the remaining ranks are pinned to five CPU cores. When two jobs are run concurrently, each MPI rank is bound to a single CPU core.
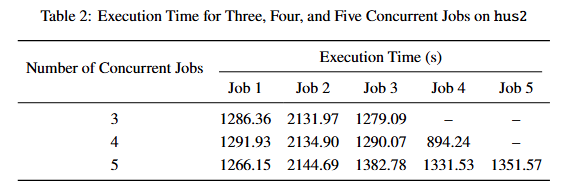
On hus2, after enabling MPI rank pinning, a clear imbalance in execution time can be observed when two jobs are run concurrently. As the number of concurrent jobs increases, the execution times on hus2 exhibit increasingly pronounced performance imbalance (see Table 2). Could this behavior be related to contention for shared resources within the node, such as limitations in memory bandwidth or differences in memory access locality arising from the NUMA architecture?
Thanks again for all the detailed explanations and guidance — they’ve been really helpful for understanding performance behavior on high core-count CPUs. We’re looking forward to your analysis of the data, which should help us better pinpoint the source of the performance degradation on hus2.